A guide to your reporting page
In this guide we take a look at your reporting page and the different graphs, statistics and filters that can help you analyse your data to get a better understanding of how your business is performing so you can optimise your processes.
Run a report
Graph tab
- Select the data you want to view under each filter and press “Run report“.
- If you do not select any data under a filter, all data will be included. You only need to select data under the filters if you only want to include certain data.
Sales statistics / Other statistics tab
- Select the data you want to view under each filter and press “Generate new report” to view the donut charts or press “Export raw data” to receive an email with a download link to all of the data for that period.
- If generating a new report, you will then see a message saying we are processing your report. Once the report is ready you’ll receive an email. You can also press the “refresh” button to see if the report has finished processing.
- If requesting a raw data export, you will receive an email with the download link once the spreadsheet has been compiled.
- There is an overlay bar on each tab that allows you to view your data by Overall, Source, Job type, User and Postcode. This is designed to make analysing your data faster without the need to apply overlays.
Changing filters
- Press the “clear current report” button.
- Select the filters to be applied and press “Run report” to generate a report with new data.
- You will see the same holding message and we’ll email you when you report us ready.
- A dropdown will be available allowing you to view reports you’ve run in the last 24 hours so you don’t need to keep regenerating reports you’ve previously created.
FAQs
- Data limits – a maximum 12-month date range selected (any 12-month date range).
- Loading – statistics will load in sections. As you scroll down the page, more metrics will load.
- You will be sent an email when your report is ready to view. Open the reports page and press the “refresh” button to load your report.
- Who can view reports?
- Super admins – any super admin can run reports for all data on the account.
- Regional / Regular / Custom users – by default these users cannot view reports. In your user settings, you can provide access to reporting for regional and/or regular users under the user access settings tab. Once active, a regional or regular user can view reports on any records they are assigned to. They cannot view overall reports.
Graph tab
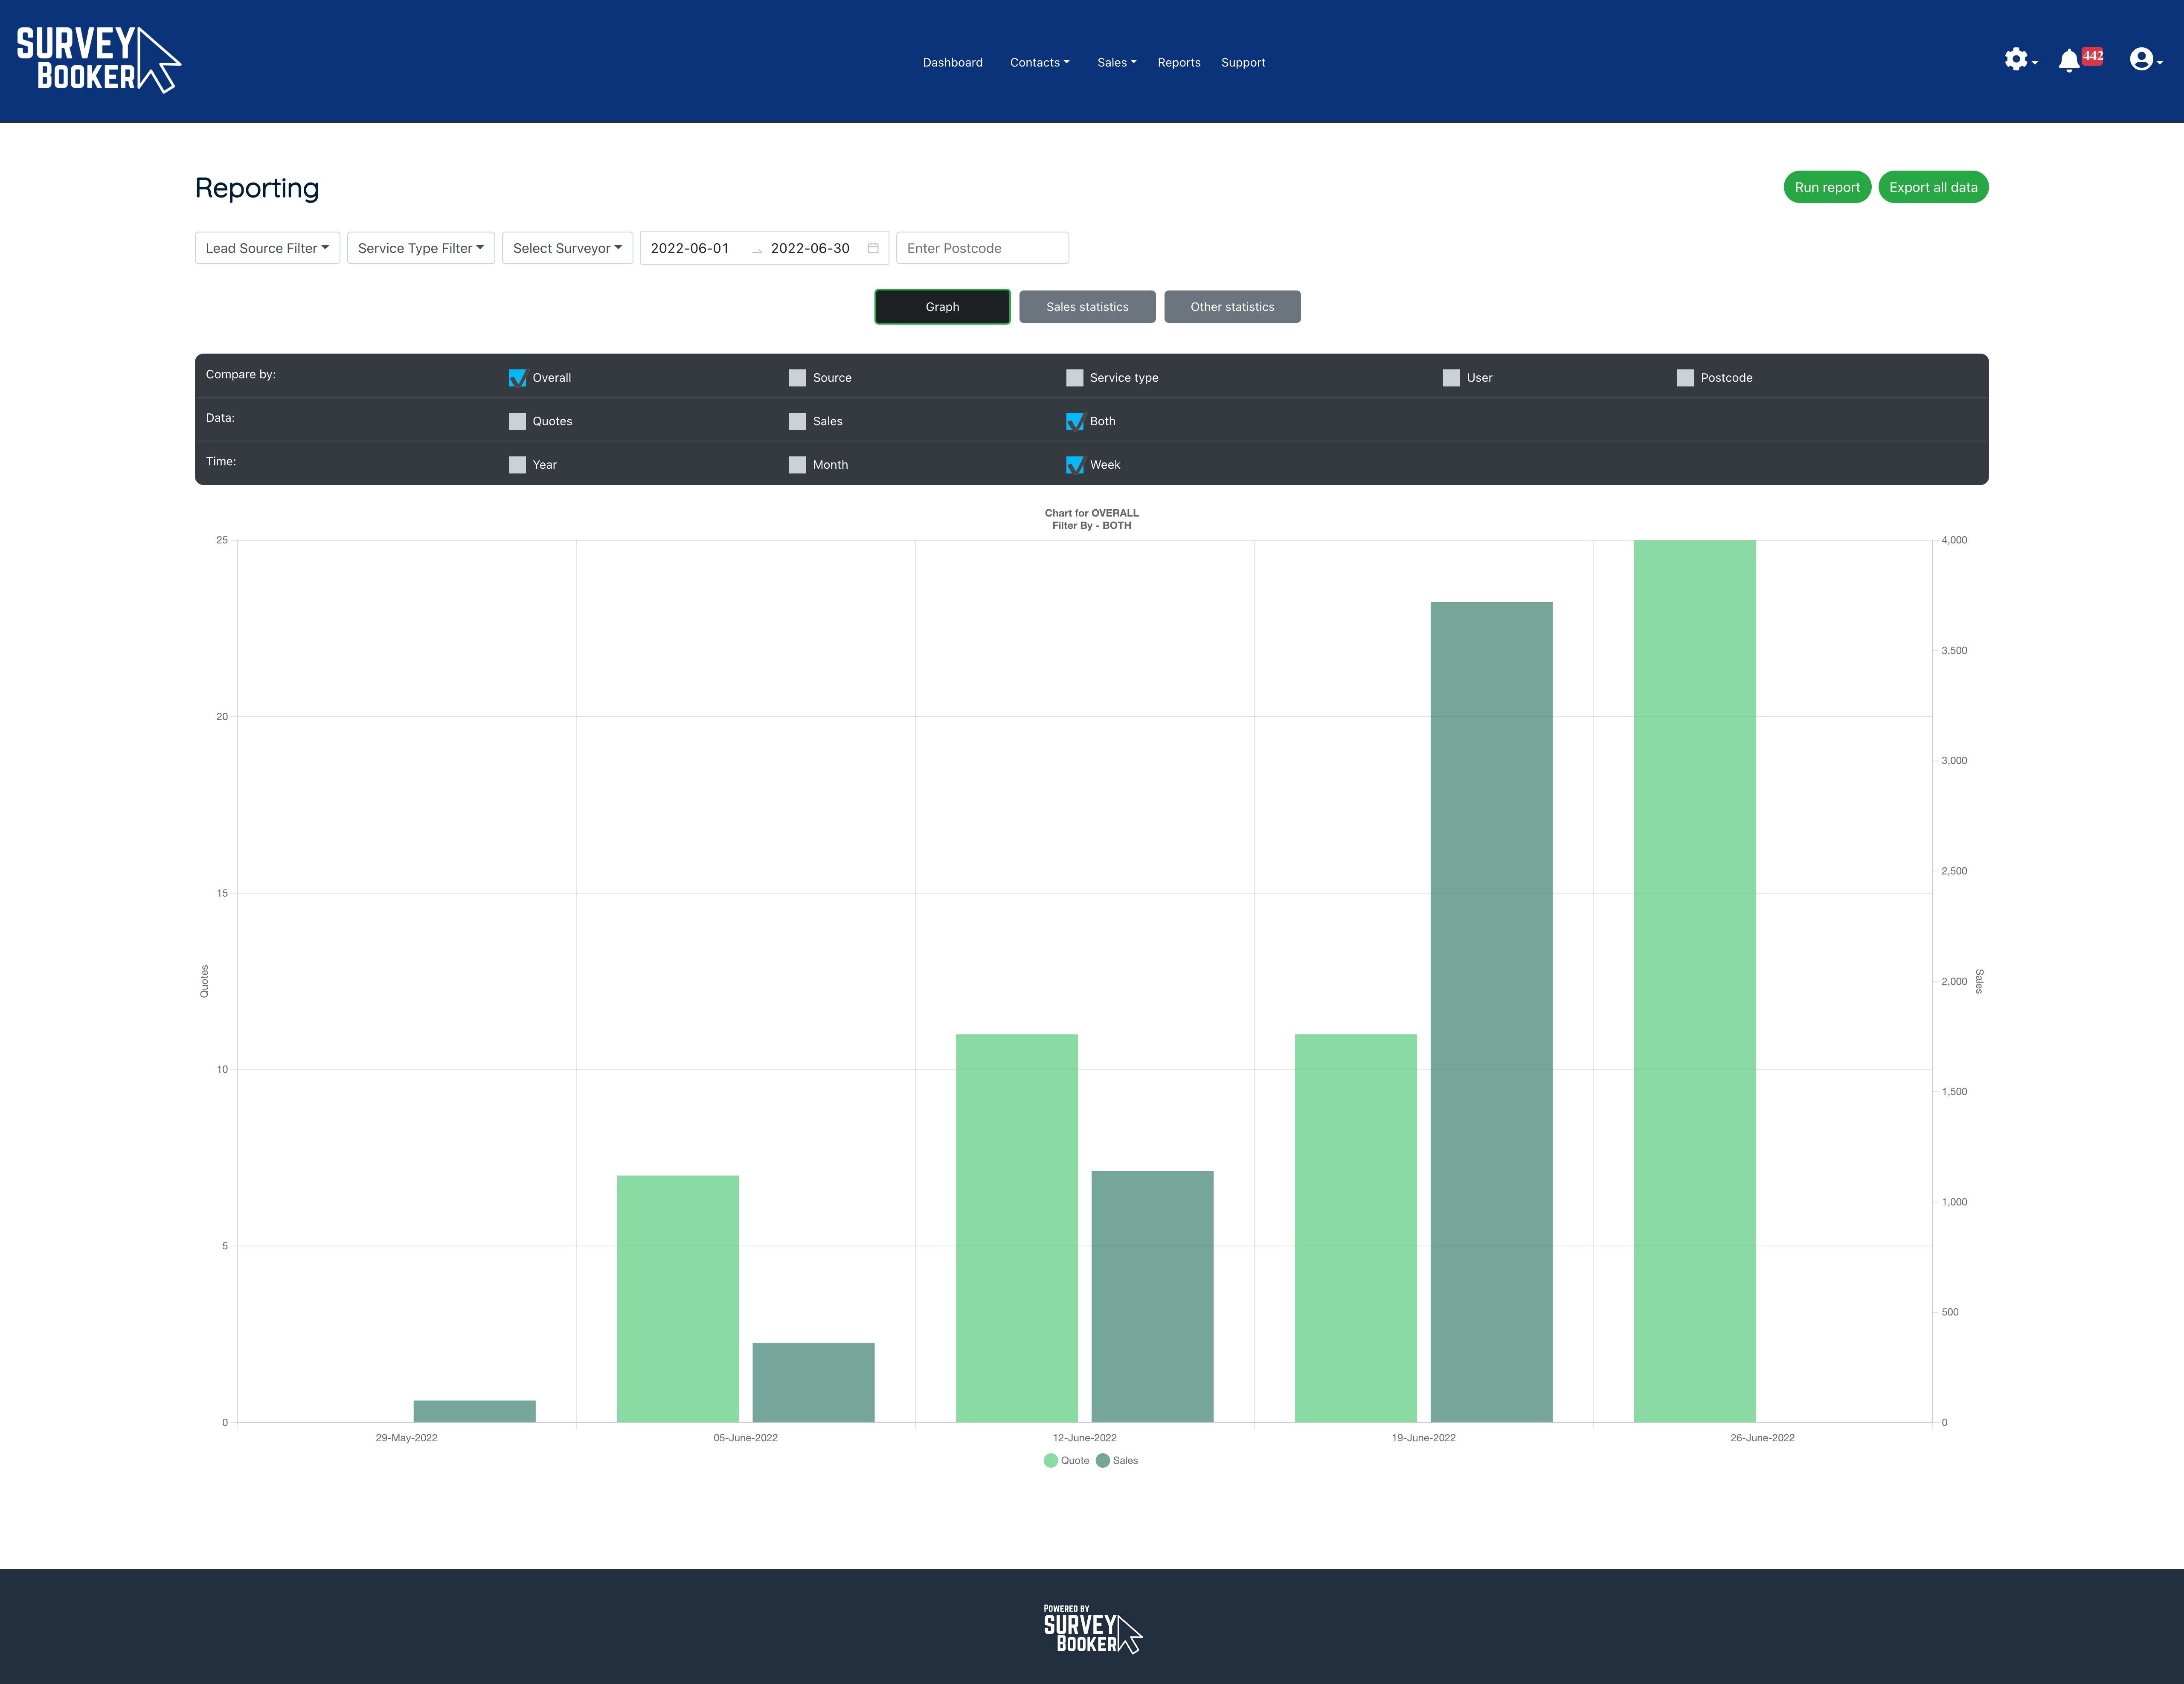
The graph tab provides a visual overview of your quotes received and sales received. You can view just quotes volumes, just sales volumes or both side by side. This can be displayed by year, month or week.
Quotes: this shows the number of quotes created in that date range. E.g. a quote created in July will show under July.
Sales: this shows sales generated from any quotes created in the time period selected. We consider a job as a ‘sale’ once it has been accepted.
Example: select June dates and display the data by week. Each sales bar will show how much revenue was generated from the quotes received in that week. This gives you a direct comparison of how quotes received at different times have converted into revenue. If you accepted a job in June for £500 but the quote record was created in May, the value of £500 would show in the sales bar for May. This is to directly show what the quotes received in May generated in sales.
To view the value of jobs accepted in a particular date range, please see the “Total revenue” figure in the “Sales Statistics” tab. This displays the value of all jobs accepted in the date range selected (regardless of when it was created).

Sales Statistics tab
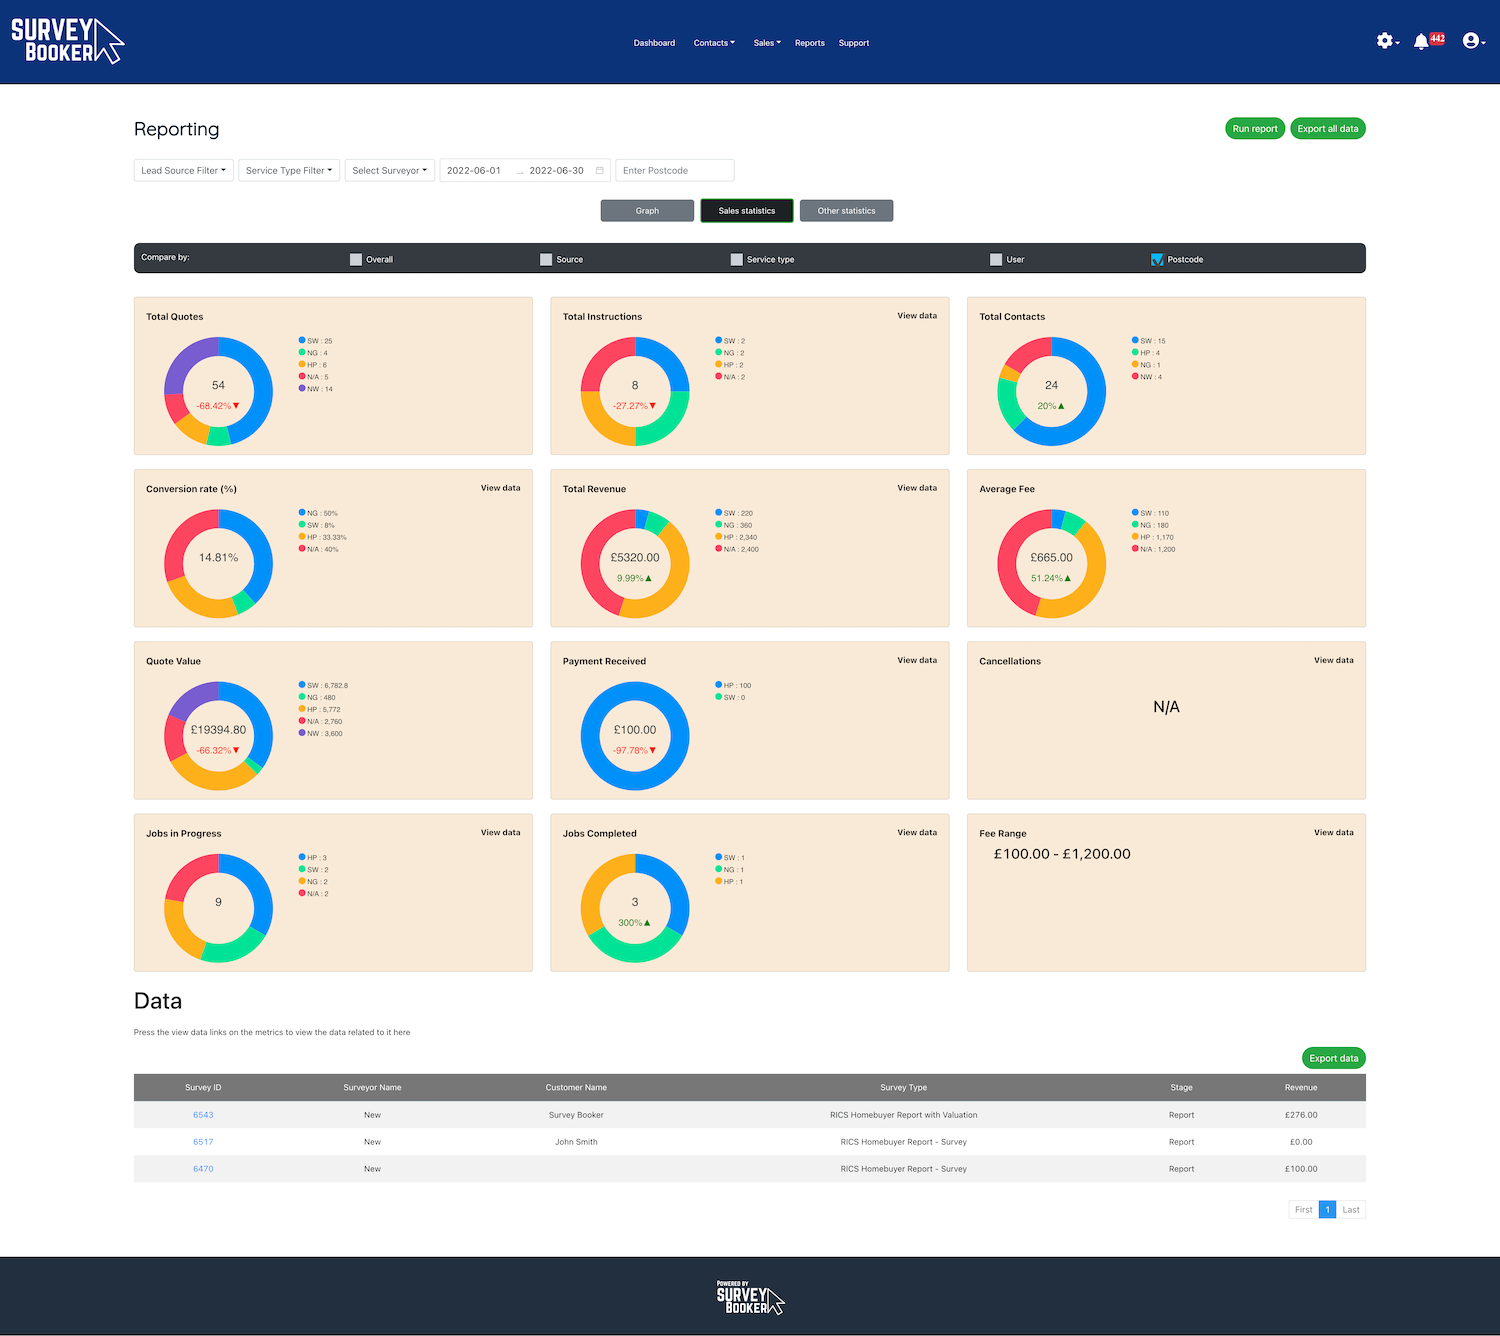
The sales statistics tab provides a number of metrics.
- Total quotes – all quotes created in the date range (not including deleted records).
- Total instructions – the number of records with an accepted date in the date range (regardless of created date)
- Total contacts – the number of unique contacts associated to quotes created in the date range.
- Conversion rate – the number of jobs accepted on quotes created in the date range / number of quotes created in the date range.
- Example 1: August dates selected:
- Total quotes received: 100
- Total instructions: 50
- Conversion rate 30%
- The reason for this is that of the 50 total instructions, only 30 jobs accepted were on quotes created in August. The remaining 20 are jobs accepted on quotes created in July. Therefore, you have actually converted only 30% of your August quotes. The conversion rate for July also increases as you have now converted more of your July quotes.
- Example 1: August dates selected:
- Total revenue – value of all jobs accepted in the date range (regardless of created date)
- Average fee – average fee of jobs accepted in the date range (regardless of created date)
- Quote value – the total value of quotes created in the date range
- Payment received – the total value of payments received in the date range (based on payment date).
- Cancellations – any booked record that was cancelled in the date range (regardless of created date)
- Jobs in progress – the number of jobs with accepted, booked, preparing report status (limited to last 4 months)
- Jobs completed – the number of jobs with a report upload date in the date range (regardless of created date)
- Fee range – the value of the lowest value and highest value record with an accepted date in the date range (regardless of created date)
Note: cancelled surveys are removed from the total revenue and payments received values.

Other Statistics tab
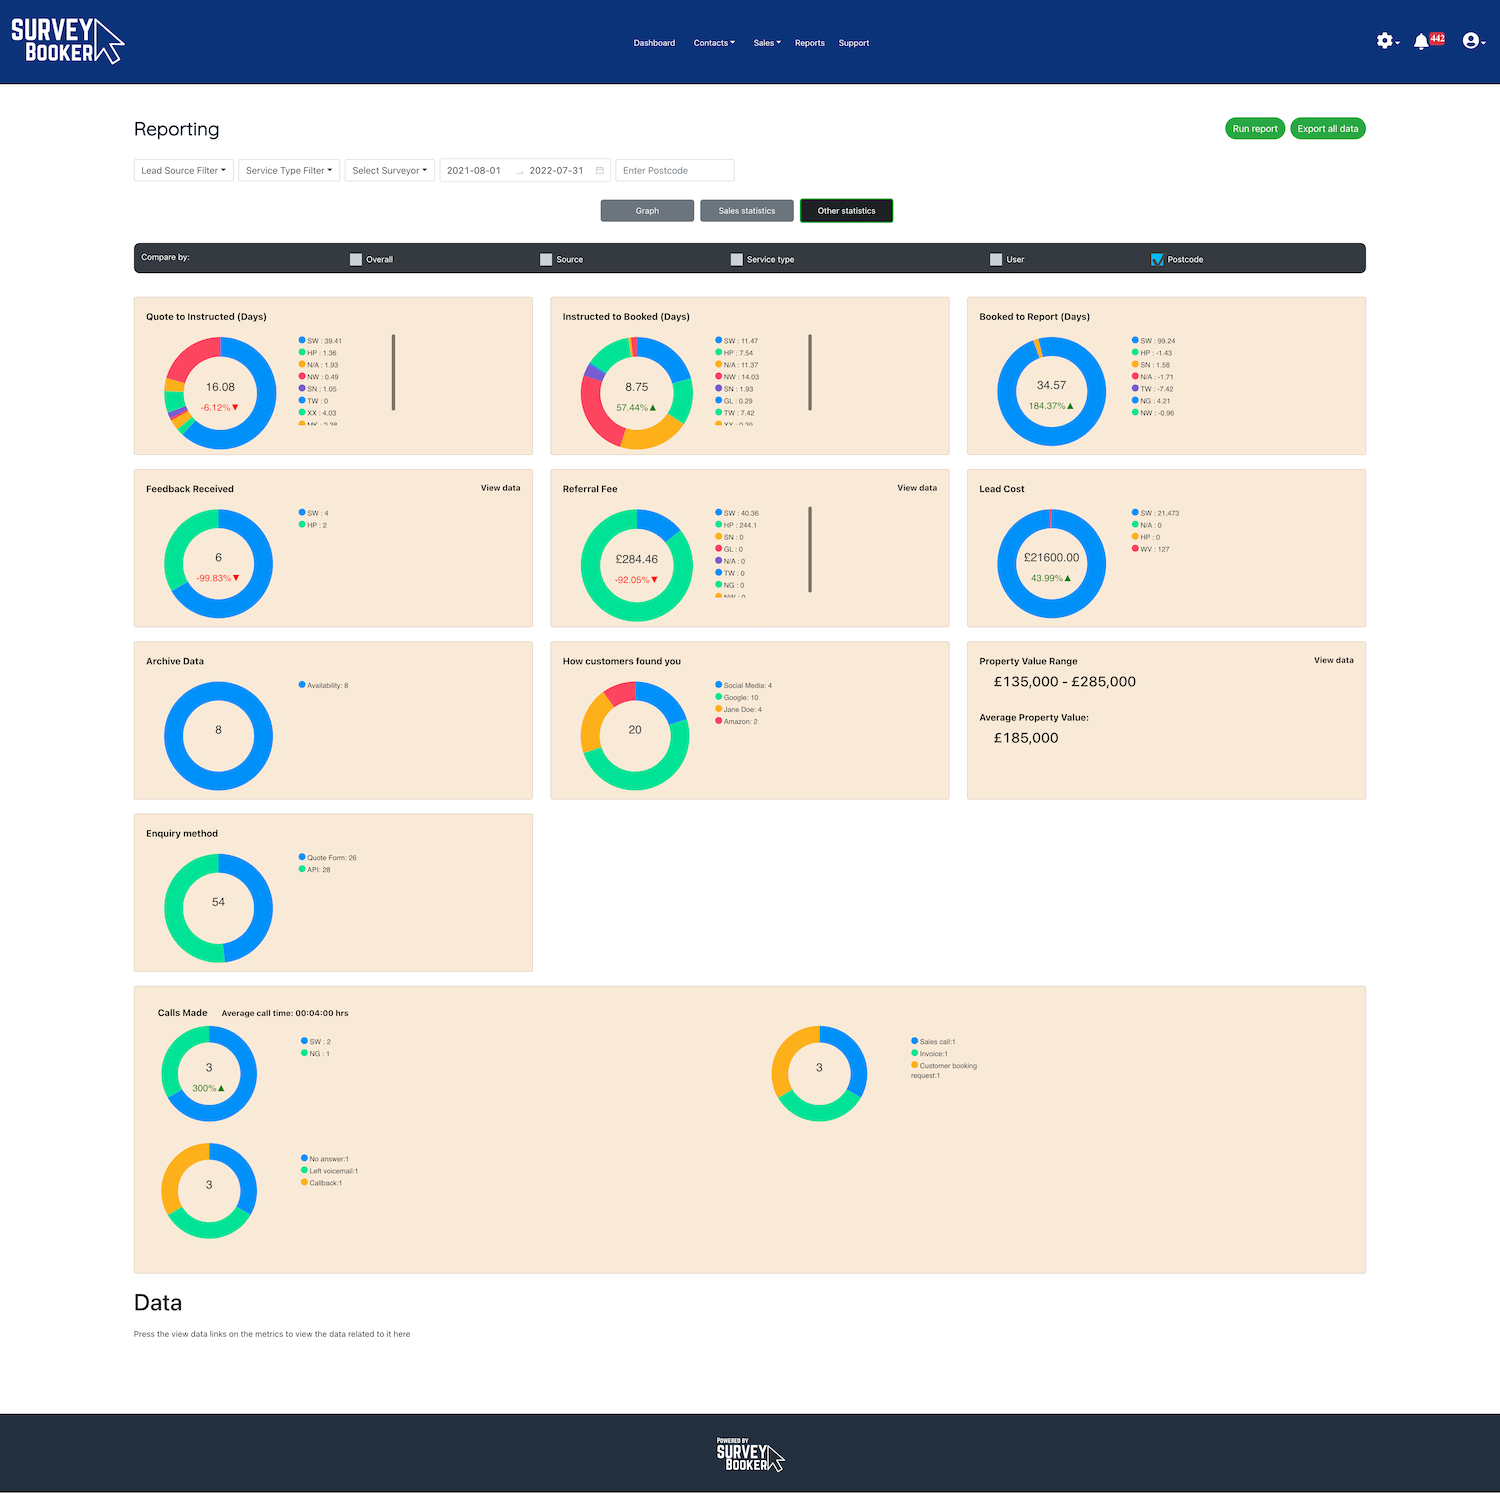
These statistics are typically less sales focussed and more about performance.
- Quote to Instructed – the average turnaround time in calendar days between the quote created date and accepted date.
- Instructed to Booked – the average turnaround time in calendar days between the accepted date/time and and the date/time the inspection date was added (not the appointment date).
- Booked to Report – the average turnaround time in calendar days between the inspection (appointment) date/time and the report upload date/time.
- Feedback received – the total number reviews left by customers using our internal review system.
- Referral fees – the value of referral fees due on jobs completed in the date range (report upload date)
- Lead cost – cost of leads created in the date range.
- Archive data – reasons for records being archived based on date on record created date.
- How customers found you – displays a breakdown of the marketing source listed on the job timeline (or quote form based on plan). Based on created date.
- Average property value – average value of properties linked to jobs accepted in the date range.
- Property value range – range of property values on jobs accepted in the date range.
- Enquiry method – displays a breakdown of the enquiry method used from the job timeline based on created date. API / Quote form is automatically applied to created jobs based on the source but for manually added quotes you can set the enquiry method as phone / email.
- Calls made – the total number of call logs made on job timelines based on the date the call log was created.
Note: cancelled surveys are removed from the values.

Data Exports
There are 3 types of report exports you can pull from the system, which are:
- Export raw data – this will compile and email you a spreadsheet with all of the data related to your report
- Export statistics – a spreadsheet that will contain all the statistics from your report
- Metric data export – this will export the raw data related to a specific metric
Raw data export
Once pressed, the system will queue a request to produce a spreadsheet with all of the data related to a report. You can request this without needing to generate a report.
The spreadsheet produced includes all data related to the selected filters and date ranges. You can filter this data further in your spreadsheet. You will be sent a link to download the spreadsheet once compiled. Note: if the report doesn’t download when clicking on the download button, copy and paste the link into your browser.
Export statistics
Once you have viewed the sales statistics tab and the other statistics tab, the system will have loaded all data related to the selected filters and all of the metrics. A button will appear at the top right of the page to export all of the statistics to a spreadsheet.
- The metrics here are based on what is shown on the reporting tabs (e.g. quotes based on created date, completed based on the report upload date).
- The optional extra totals are calculated based on how many instructed jobs created in the date range have an extra selected). The total column displays the count listed under assigned users. For a total including unassigned jobs you can use the surveys tab (see below).

Exports by metric
Some metrics display a “view data” link. Press this to view the data related to the metric in the table at the bottom of the page. An “export data” button will appear above the table providing the option to export the data related to that metric so you can analyse it further if needed.


