

Performance stats and goal setting
Performance stats are designed to help you understand how your team member pipelines and activity levels vs our sales reports, which outline how team members are doing on key sales metrics.
You can also set up your own user/team goals to help you monitor who is doing well and who needs a bit of support.
This is an Enterprise plan feature.
Settings goals
To personalise your reports further, you can set up your own goals to track how team members are performing. These can be selected when running a report and all the statistics can be exported from the report page.
Setting up a goal: Navigate to Settings > User settings > Goal settings tab (if enabled)
Press Add goal and enter the details required to create it:
Goal name: enter a name that helps you identify what this goal is for future editing or selecting in a report
Select user type: select a team or select specific users that this goal is applicable to
Select metric goal:
- Lead conversion goals – these are goals related to your quotes/jobs assigned users
- Referrer goals – these are goals related to your referral partner account managers
Select metrics value:
- Lead conversion goals
- New leads – the number of leads allocated to that user in the given day/week/month. Count methods – Count/Sum (count and sum will be the same). If you set any other method, it will return ‘1’. Lead created between from and to date for the report timeframe.
- New instructions – based on the accepted date of a job. Count methods – Count/Sum (count and sum will be the same). If you set any other method, it will return ‘1’. Includes all non-cancelled leads accepted onwards, with the accepted date between the From Date and To Date.
- Conversion rate – based on the number of jobs accepted created that day/week/month
- This may differ to the sales report conversion rate if the assigned user on jobs is also the account manager for referrers and the leads that have come in from their referral partners haven’t converted, but their own assigned leads have or vice versa). E.g. Assigned = 5 leads + 2 other leads created that are referrer-linked as the account manager = 7. Converted = 5 → 71%.
- Count methods – Average.
- Total leads created between the from and to date that have been accepted onwards, divided by total leads created between the From Date and To Date, multiplied by 100.
- Conversion time – based on the accepted date of a job. Count methods – Count/Sum/Average/Min/Max. Includes jobs created between the report From Date and To Date, that are accepted onwards, considering the time difference between the Created Date and Accepted Date in minutes.
- Payments received – Count methods – Count/Sum/Average/Min/Max. Total paid value of non-cancelled surveys paid by users where the payment date is between the From Date and To Date.
- Booking value – Count methods – Count/Sum/Average/Min/Max. Total final price of jobs paid by users where the payment date is between the From Date and To Date.
- Total points – Count methods – Count/Sum/Average/Min/Max. Total points of jobs with an accepted date between the From Date and To Date based on the points value set in the select service settings.
- Calls made – Number of calls added by the user, but this metric only counts survey-related call logs (not other types like referrer, contact, or property). Count methods – Count/Sum.
- Call time – Duration of call logs created by a user on survey records between the From Date and To Date. Duration calculated as the difference between Call End Time and Call Start Time in minutes. Count methods – Count/Sum.
- Referrer goals
- Referral new leads – Leads/jobs created between from and to date selected, where the user is the account manager of the referrer assigned as the source. Count methods – Count/Sum (both will give the same value).
- Referral payments – Value of payments received on non-cancelled surveys paid by customers where the payment date is between the from and to date and the job source is a referral partner that the user is the account manager for. Count methods – Count/Sum/Average/Min/Max.
- Jobs completed – Number of jobs from referrers managed by that user with a completion date in the time frame. Count methods – Count/Sum.
- Meetings booked – Number of meetings booked by that user based on the meeting creation date (not the meeting date). Includes tasks set as meetings on any record type. Count methods – Count/Sum.
- Meetings completed – Number of meetings assigned to the user that are marked as completed. Based on the date that the meeting was marked as completed (not the meeting end date). Count methods – Count/Sum.
- Calls made – Total calls logged as outbound by the account manager between the created from and to dates. Includes calls logged against referral partner records only. Count methods – Count/Sum.
- Call time – Total call time for all calls logged against referral partners (inbound and outbound) created by the account manager between the from and to dates selected. Duration calculated as the difference between the call end time and start time, in minutes. Count methods – Count/Sum/Average/Min/Max.
- Terms sent – Number of terms sent to referral partners by that account manager between the from and to dates (including terms that have been completed). Count methods – Count/Sum.
- Terms received – Number of terms signed by referral partners by that account manager between the from and to dates. Count methods – Count/Sum.
- New referrers – Number of new referral partner records created between the to and from dates selected that are assigned to the account manager.
- Active referrers – Total number of referrers created in the date range, assigned to that account manager, that have moved to Active. For example, if 10 new referrers are created in the date range and 6 of them have the active status, then 6 are considered converted. Count methods – Count/Sum.
Goal value: the target value you want users to reach
Calculation method:
- Sum – the added total of all values for the metric
- Average – the average of the value for the metric
- Min – the lowest value for the metric
- Max – the highest value for the metric
- Count – the total number of data entries for the metric
Timeframe
- Day
- Week
- Month
Ranking method:
- Higher is better – e.g. higher payments value is better
- Lower is better – e.g. lower conversion time is better
Active goal – tick to make it active. When inactive, it will not show in the performance stats generate report pop-up.
You can either edit a goal to make it inactive or delete a goal to remove it entirely.

Running a report
Navigate to Reports in the menu bar and then select “Performance stats” from the dropdown.
Press “Generate report”
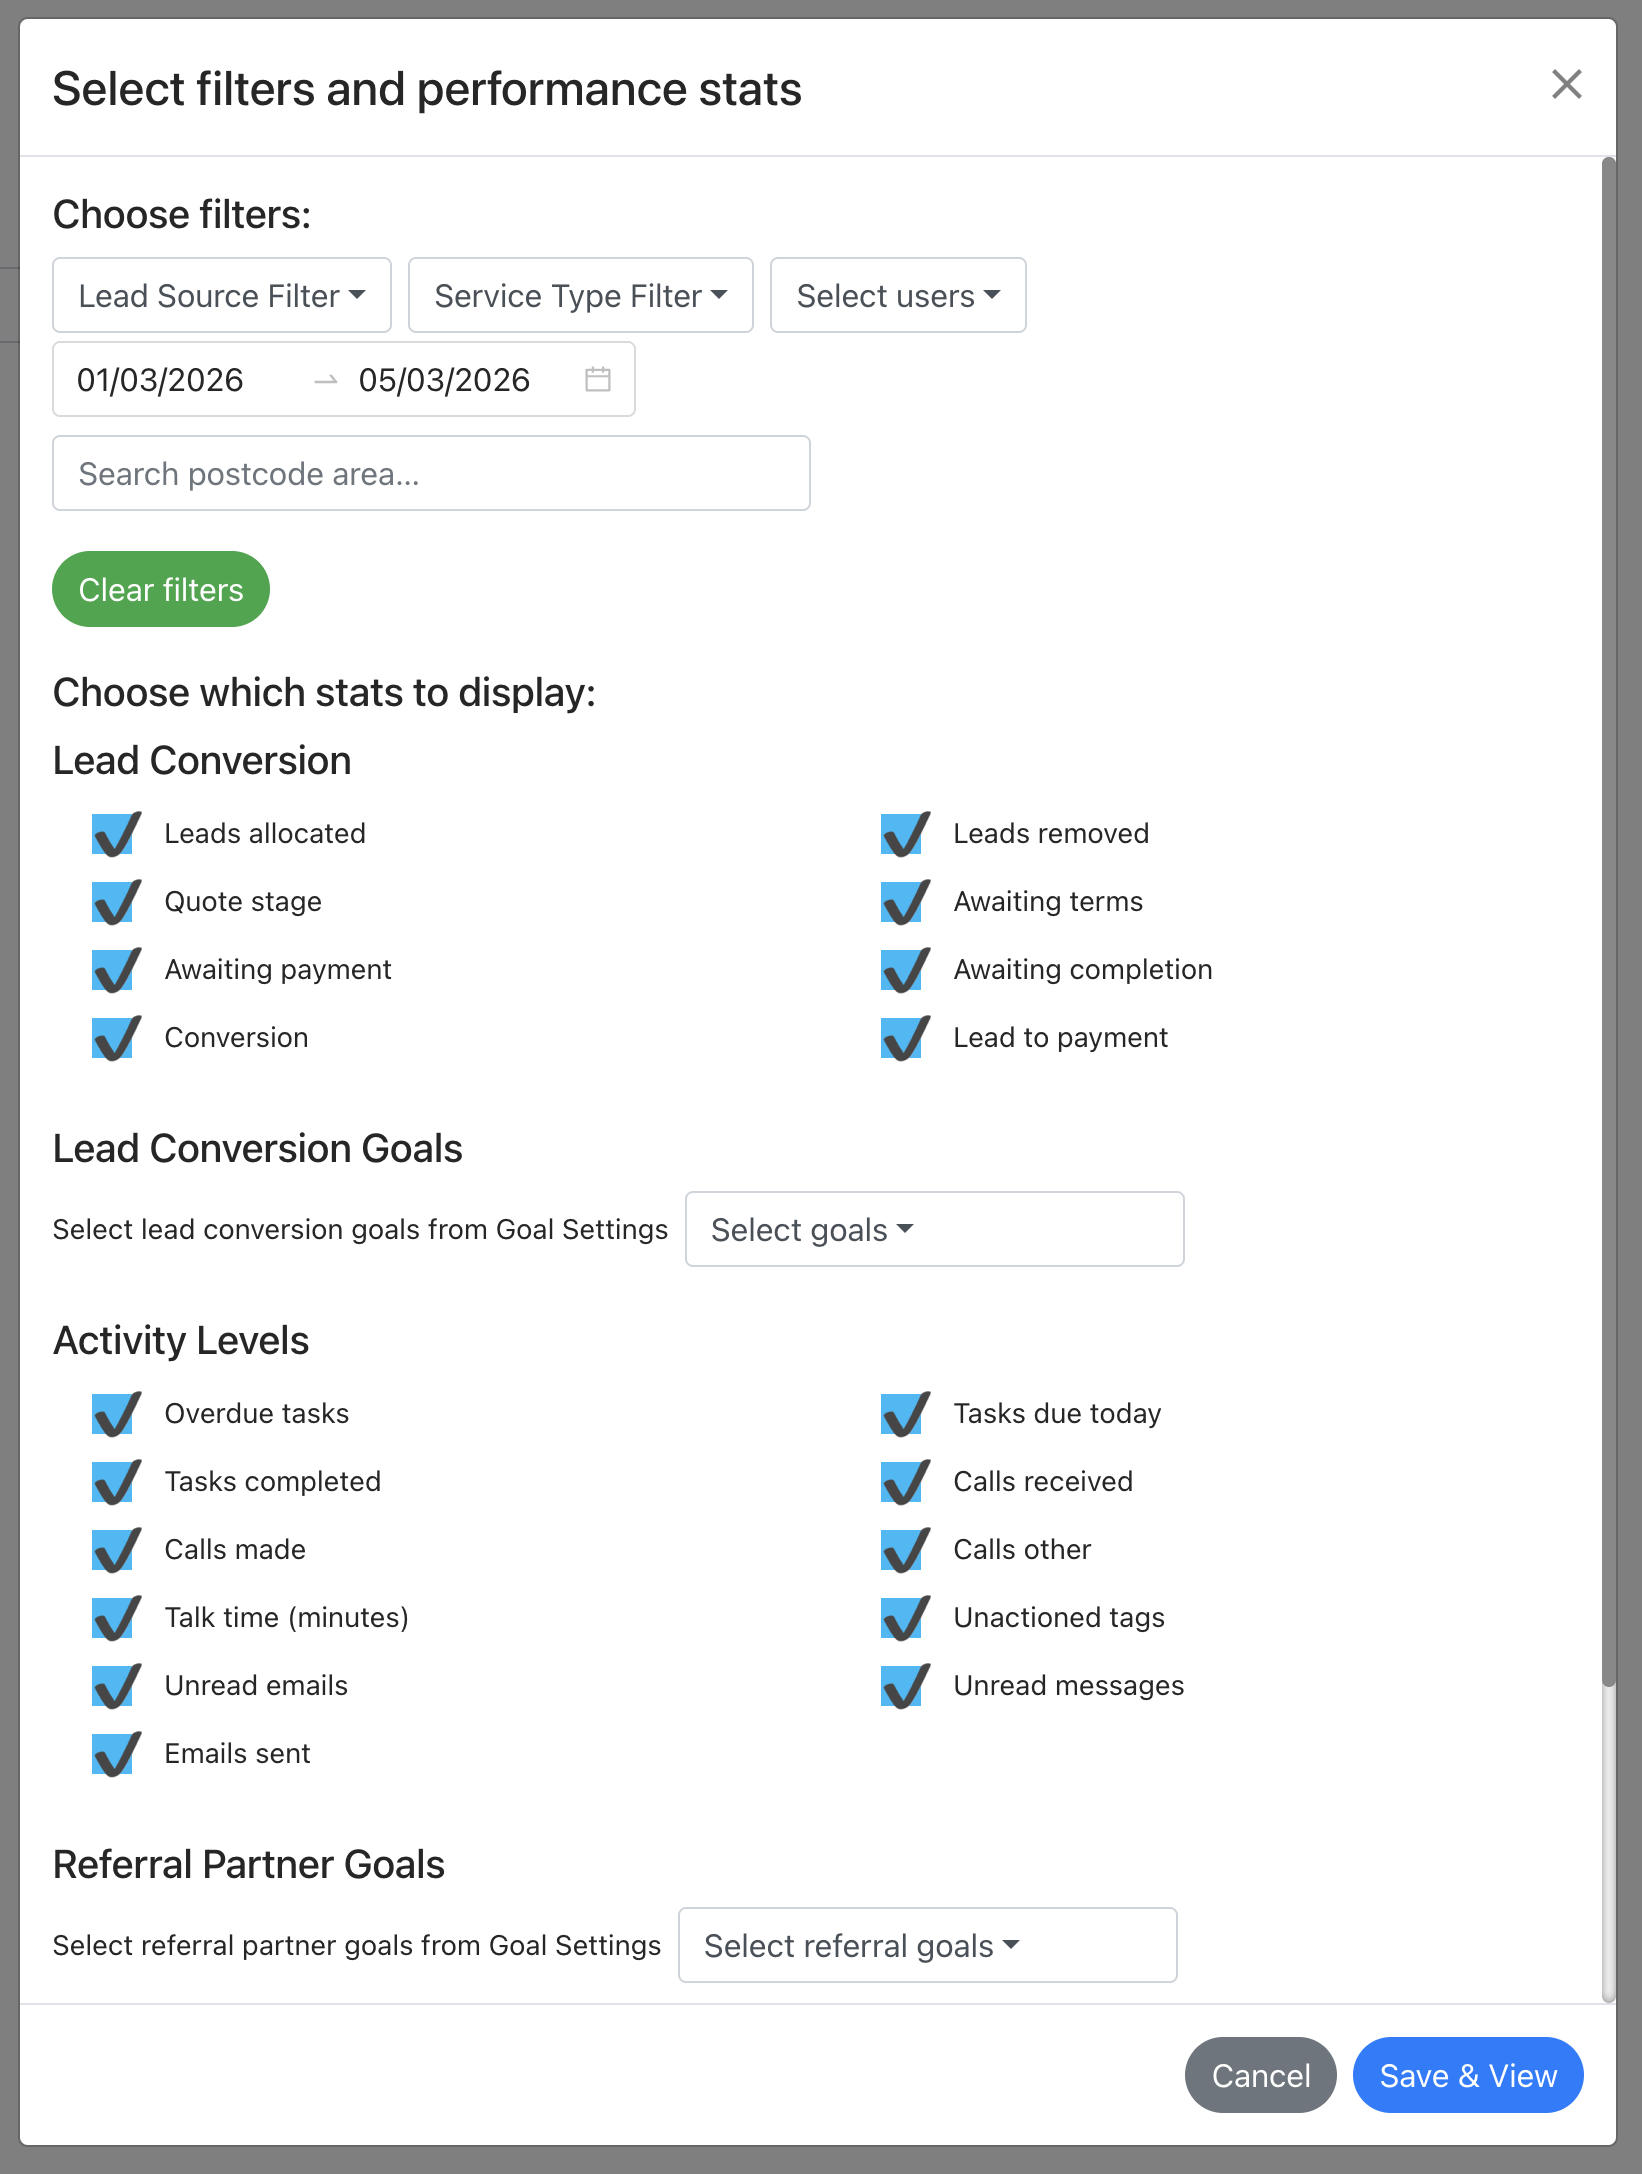
The pop-up will list different metrics that you can select – your previous selection will show here to save you from having to select the same options each time you run a report.
Choose your filters – this may just be a date range but you can make the report more granular by location, lead source, user or job type if needed.
Lead Conversion
- Leads allocated
- Assigned user: Number of leads allocated to the user in that time period selected
Account manager: Number of leads added that are related to referrers they’re the account manager of. E.g. 20 leads created, 10 are for referrer partner’s that they’re the account manager of, so we show 10 next to that account manager
- Assigned user: Number of leads allocated to the user in that time period selected
- Leads removed – Number of leads removed (unassigned) from that user in the time period (was allocated and then removed from them
- Quote stage
- Assigned user: How many allocated leads at quote stage (no terms sent / not progressed) based on created date of record
Account manager: How many allocated leads at quote stage from referrers they manage (no terms sent / not progressed) based on created date of record
- Assigned user: How many allocated leads at quote stage (no terms sent / not progressed) based on created date of record
- Awaiting terms – How many jobs awaiting terms back from the customer (for both assigned user and assigned account manager if a referral lead)
- Awaiting payment – How many jobs are outstanding payment (for both assigned user and assigned account manager if a referral lead). The count is shown against the created date of the job.
- Awaiting completion – How many live jobs are to be completed (for both assigned user and assigned account manager if a referral lead). The count is shown against the report due date and will be included once a report due date is set and the job is not completed.
- Conversion – Number of leads created in timeframe converted (accepted). The count is listed against the created date. For a percentage, please create a conversion goal.
- Lead to payment – How many days from created date to payment date (average for all jobs paid in the period that are allocated to them)
Lead conversion goals
Based on the goals you created above.
Activity Levels
- Overdue tasks – number of tasks assigned to user that are currently overdue
- Tasks due today – number of tasks assigned to user that are due today
- Tasks completed – number of tasks completed in the date range (based on task completed date)
- Calls received – inbound calls logged by/to that user
- Calls made – outbound calls logged by/to that user
- Calls other – any calls by that user not logged as inbound/outbound
- Talk time (minutes) – length of time on calls
- Unactioned tags – tags assigned to that user not marked as seen added across all records.
- Unread emails – unread emails on jobs assigned to that user (against job records only)
- Unread messages – unread messages on jobs assigned to that user (against job records only)
- Emails sent – emails sent manually by that user across all record types
Referral partner goals
Referral Partner Pipeline
- Terms sent – number of referrers with terms sent out in the date range
- Live – total assigned referrers to that user that moved to live status on that day/week/month
- Active – total assigned referrers to that user that moved to active status on that day/week/month
- Lapsed – total assigned referrers to that user that moved to lapsed status on that day/week/month
- Meetings booked – the number of meetings created (based on created date)
- Meetings completed – the number of meetings completed (based on meeting end date)
Which users can see these reports?
- Super admin users – can view all data
- Regional users – can view all data
- Regular users – can only view their own stats
- Custom users – access is based on the access level provided in the custom user profile (no access, own data, all data)
Viewing a report
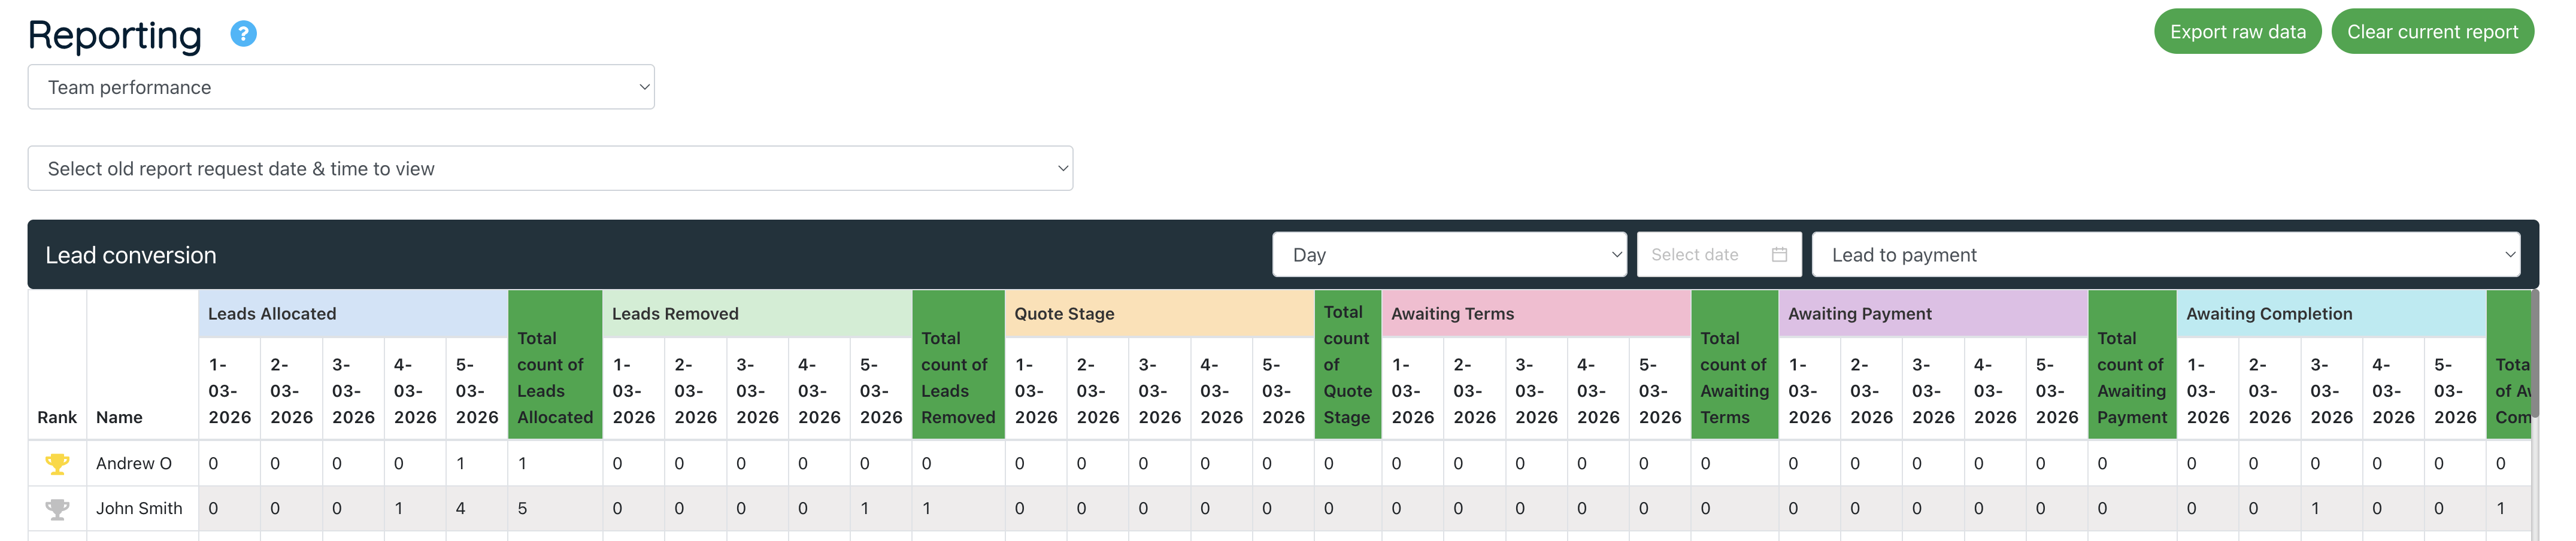
Press “Refresh” on the report to load it once it has finished processing (you will receive an email once processed).
The report will open and display all of the metrics that you selected to view. These can be filtered:
Table order / ranking – each table ranks users based on the metric selected in the dropdown for each section. You can select which metric you want to rank users by
Day/week/month filter – you can select if the report should show stats by day, week or month.
- When your report date range is up to a month, the report will give options to view the statistics by day, week or month.
- Once a report is over a month long you can view reports by week or month.
To view a specific day, week or month, select ‘week’ or ‘month’ from the dropdown, then select either a day (if day is set on the view), a week or your preferred month.
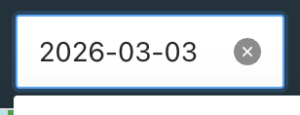
To see all data again, hover on the calendar icon in date selector filter and click the “x” that appears to remove the filter.
Goals
Daily goals will show data for up to a 1-month date range
Weekly goals will show data for up to a 6-month date range
Monthly goals will show data between a 1-month and 12-month date range
Top Referrers
This section at the bottom of the page shows you the top 5 groups, top 5 branches and top 5 contacts that have sent you referrals so that you can see who the main drivers of your referral leads are.
Export raw data
This will export the on page statistics to a spreadsheet. As you change the date and ranking formats, you can export these changes.
Colour coding
There are different colours used on the goals metrics to help show the level of success:
- Red – up to 79% of the goal has been achieved
- Amber – between 80-99% of the goal has been achieved
- Green – 100% or more of the goal has been achieved
Release notes
The following metrics will only work from the point of the feature being released onwards:
Lead conversion metrics
- Leads removed
Referrer partner pipeline:
- Active count
- Live count
- Lapsed count